Debug Your Project
Table of Content (ToC)
Start a debug session
Before debbugging the project, you needs to specify the serial port of the device:
Select the Serial Port:
Navigate to View > Command Palette.
Type ESP-IDF: Select Port to Use and select the command to specify the serial port of your device.
Make sure that openOCD configuration files are correct by:
Navigate to View > Command Palette.
Type ESP-IDF: Select OpenOCD Board Configuration and select the command to to choose the OpenOCD configuration files for the extension OpenOCD server.
Note
Please review Configuration of OpenOCD for Specific Target to understand which board or configuration to use for your specific hardware.
Make sure to configure your drivers as mentioned in ESP-IDF Configure JTAG Interface documentation.
(Linux users) Make sure to copy the OpenOCD udev rules files into the
/etc/udev/rules.ddirectory before running OpenOCD and starting a debug session.
To start debugging select menu Run and Start Debugging or just press F5.
You can see the output from GDB in the debug console and the OpenOCD output in the menu View > Output > Select ESP-IDF from dropdown output.
This cover the basic functionality of the ESP-IDF extension. Take a look at the Additional IDE Features documentation for more.
What happens in the background?
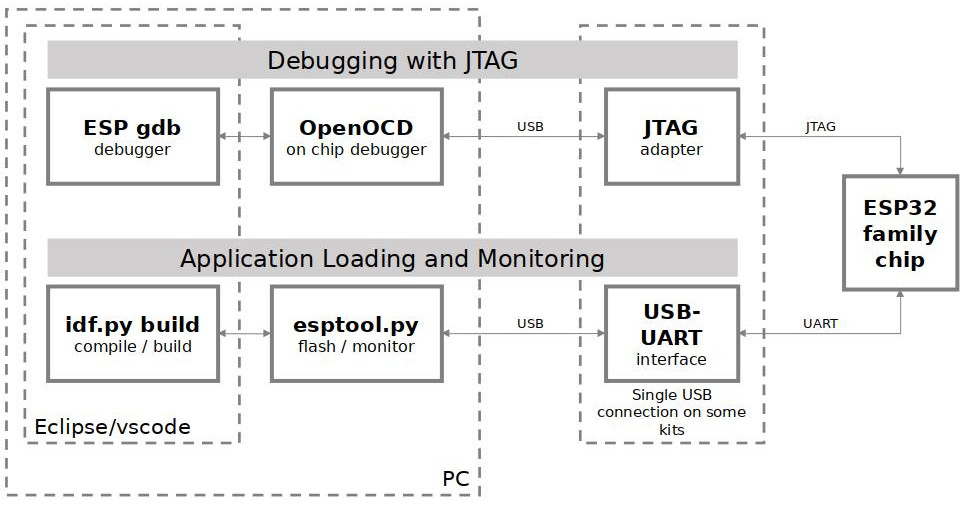
JTAG debugging - overview diagram
First OpenOCD server is launched in the background and the output is shown in menu View > Output > Select ESP-IDF from the dropdown.
By default it will be launched using localhost, port 4444 for Telnet communication, port 6666 for TCL communication and port 3333 for GDB. you can modify openocd.tcl.host and openocd.tcl.port configuration settings to modify these values. You can also set idf.openOcdDebugLevel to lower or increase (0-4) the messages from OpenOCD in the ESP-IDF output.
Next The Eclipse CDT GDB Adapter is launched in the background and the output is shown in the
Debug Console. This debug adapter will start the connection to the device by launch the GDB debug session.
This adapter is a middle man between Visual Studio Code, configured toolchain GDB and OpenOCD server. You can see how Espressif chips debugging works and how Visual Studio Code use Debug adapters to communicate with many debug tools.
Setting a custom application image offset
If you modify the application image offset you need to modify openOCD launch arguments to update the application image offset. This can happens if OpenOCD output (Menu View -> Output -> ESP-IDF) shows an error like this:
Failed to get flash maps (-6)!
❌ Error: Failed to get flash maps (-6)!
Warn : Application image is invalid! Check configured binary flash offset 'appimage_offset'.
To update openOCD launch arguments, open the project’s .vscode/settings.json and add or modify:
{
  "idf.openOcdLaunchArgs": [
    "-c",
    "init",
    "-c",
    "reset halt",
    "-c",
    "esp appimage_offset 0x20000"
  ]
}
where 0x20000 is your application image offset used in the partition table.
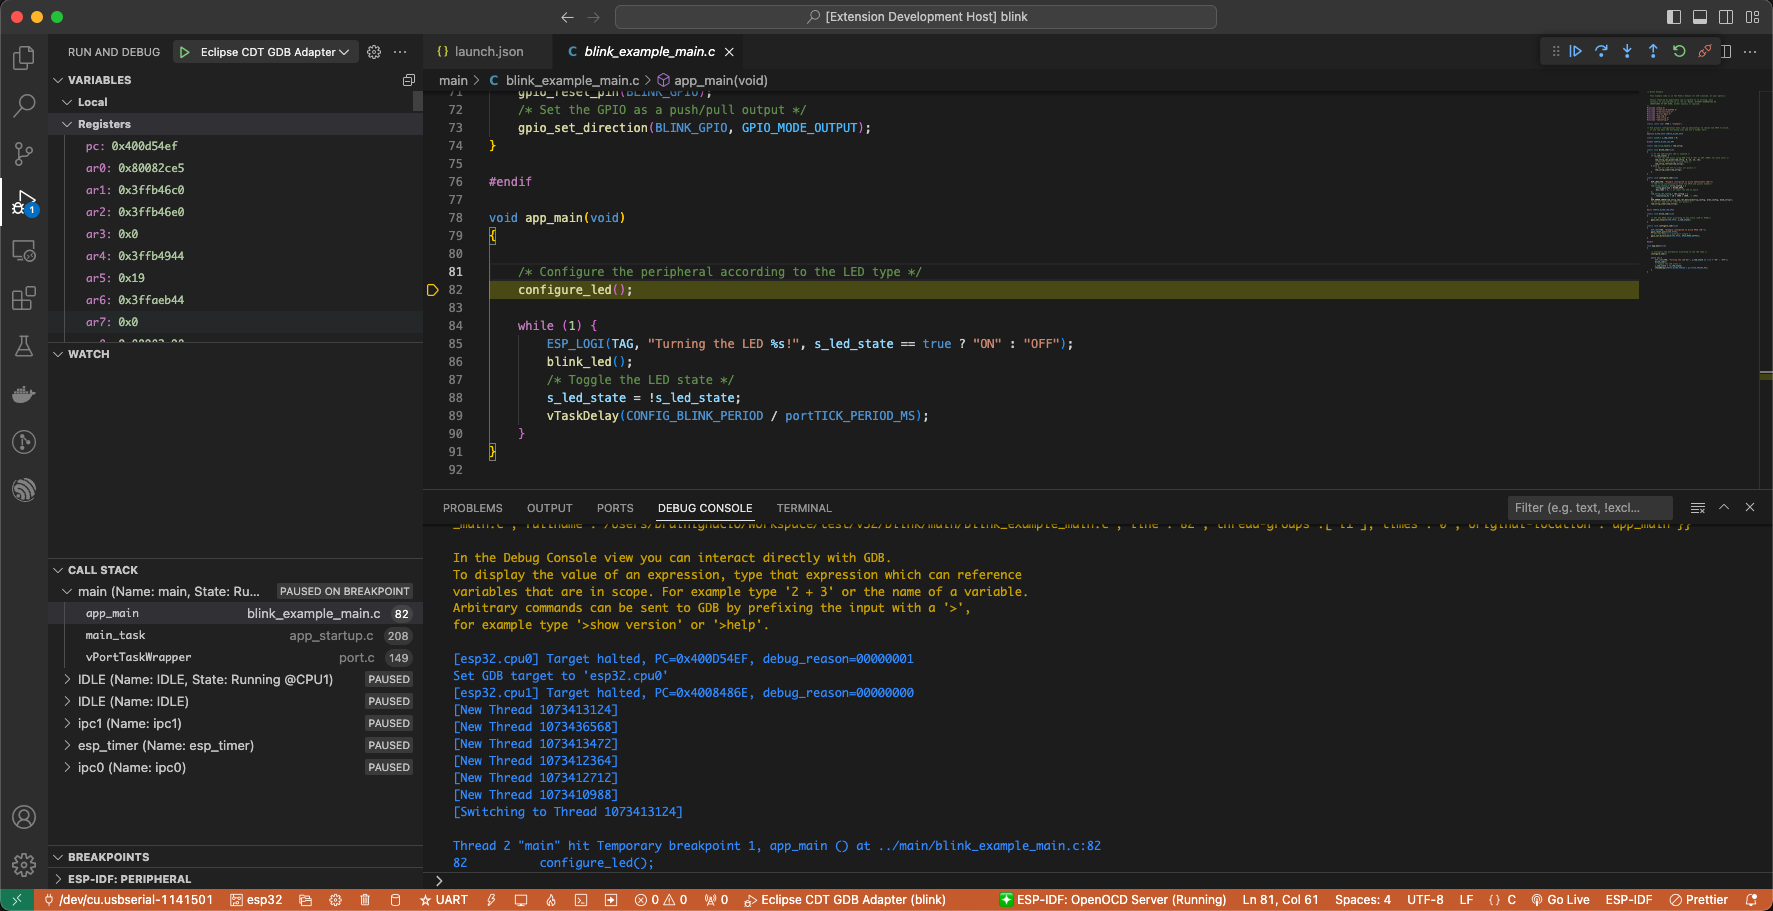
Navigating Through the Code, Call Stack and Threads
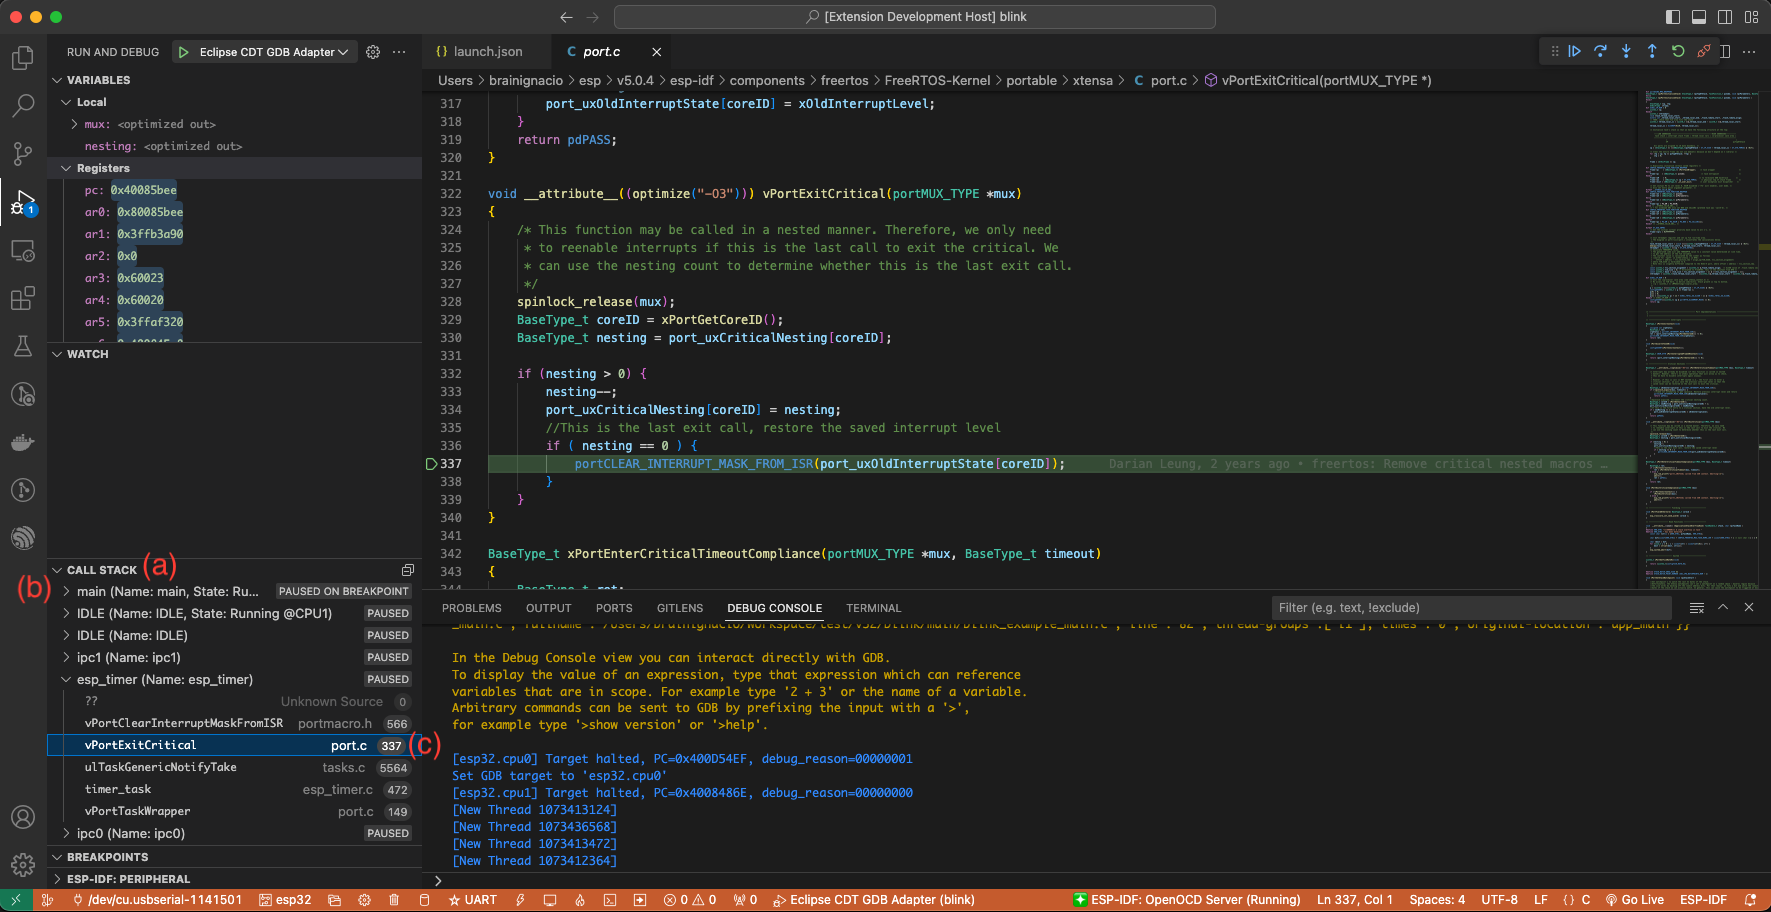
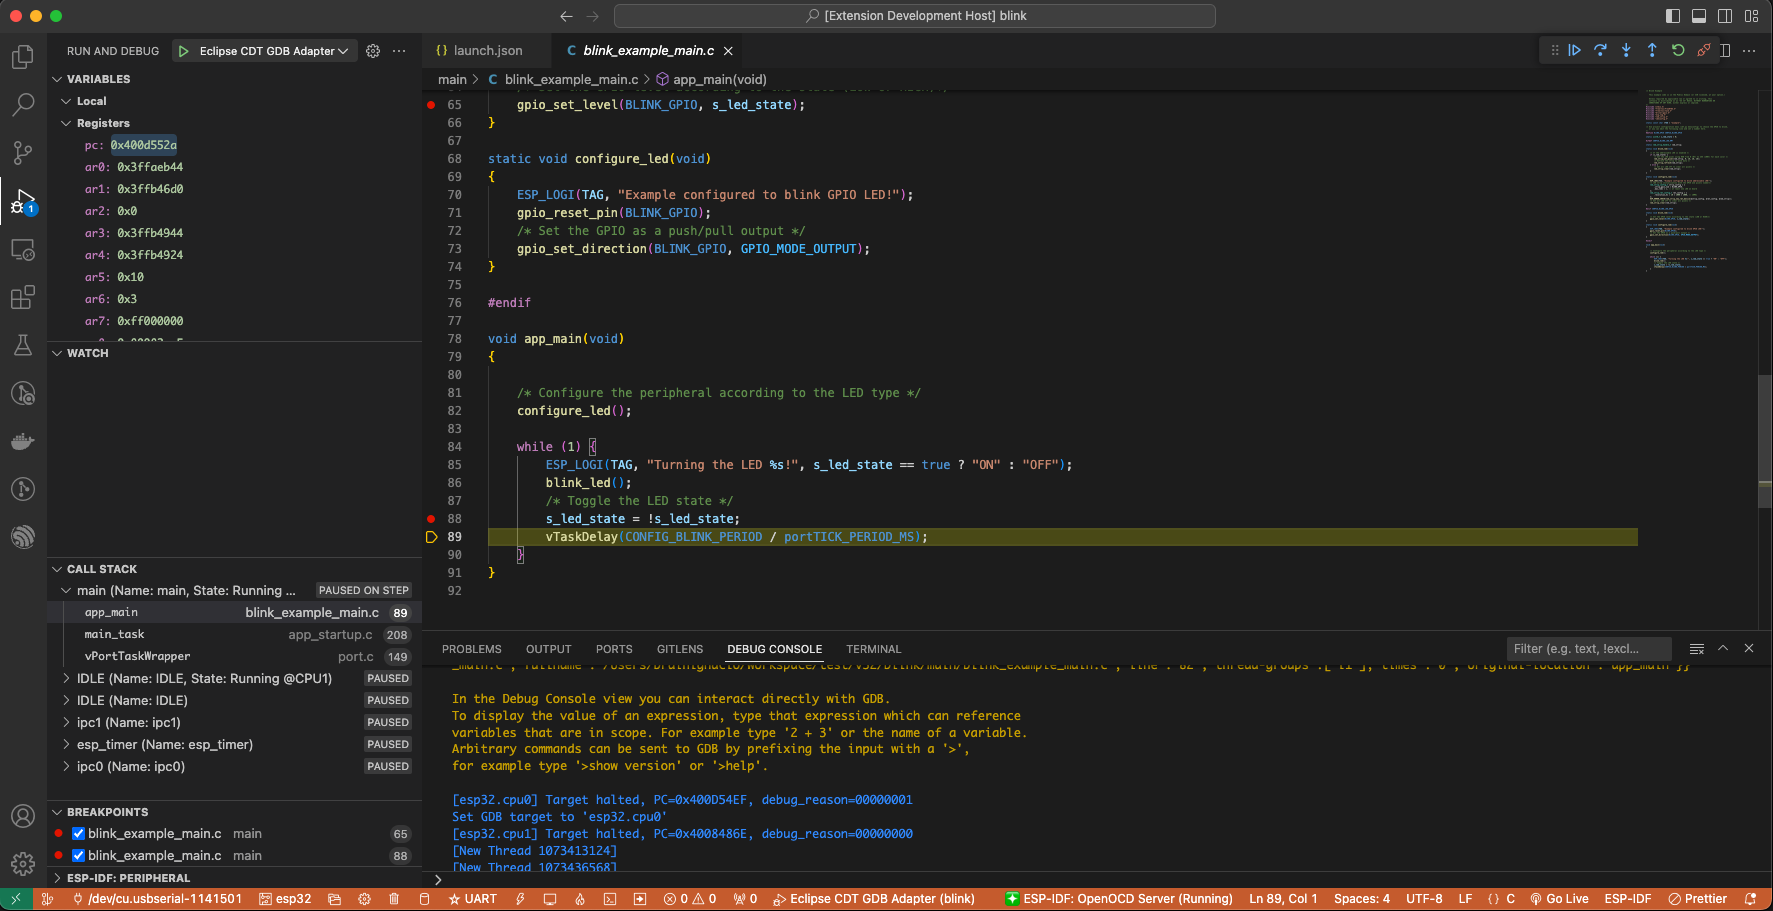
When the target is halted, the editor will show the line of code where the program halted and the list of threads in the Call Stack sub-window (a) on the Run icon in the Activity Bar on the side of Visual Studio Code. The first line of call stack under main (b) contains the last called function app_main(), which in turned was called from main_task() as shown in the previous image. Each line of the stack also contains the file name and line number (c) where the function was called. By clicking on each of the stack entries, you will see the file opened.
By expanding threads you can navigate throughout the application. Some threads contains much longer call stack where you can see, besides function calls, numbers like 0x4000bff0 representing address of binary code not provided in source form.
Go back to the app_main() in Thread #1 to familiar code of blink.c file that will be examined in more details in the following examples. Debugger makes it easy to navigate through the code of entire application. This comes handy when stepping through the code and working with breakpoints and will be discussed below.
Setting and Clearing Breakpoints
When debugging, we would like to be able to stop the application at critical lines of code and then examine the state of specific variables, memory and registers / peripherals. To do so we are using breakpoints. They provide a convenient way to quickly get to and halt the application at specific line.
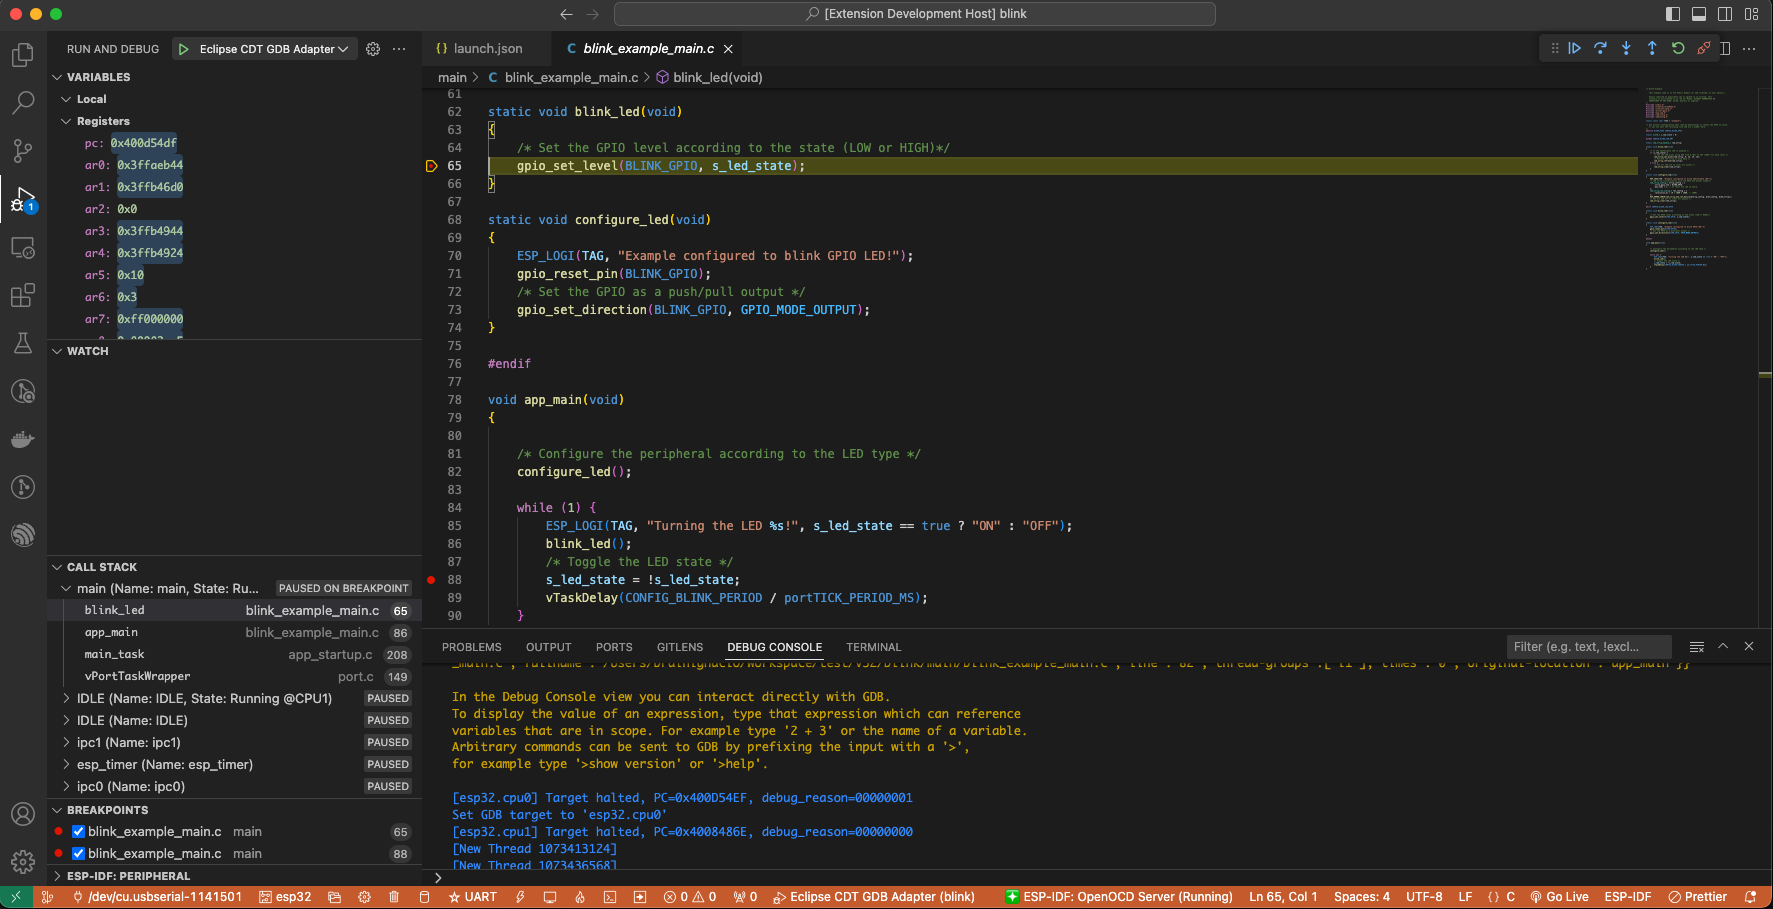
Let’s establish two breakpoints when the state of LED changes. Based on the code listing above, this happens at lines 57 and 80. To set a breakpoint, go to the desired line and press F9 or click on the circle shown next to the line number (editor margin). The list of breakpoints is shown in the Breakpoints sub-window on the Run icon in the Activity Bar on the side of Visual Studio Code.
Note
Consider that ESP32 has a maximum of 2 hardware breakpoints. Please look at ESP-IDF Debugging tips: Breakpoints for more information.
The Visual Studio Code shows a Debug toolbar on the top of the editor with several actions as explained in Visual Studio Code Debug Actions.
If you press F5 (Continue/Pause) the processor will run and halt at the next breakpoint. If you press F5 again, it will stop at the next breakpoint and so on. you will be able to see that LED is changing the state after each click to “Continue” program execution.
Read more about breakpoints under breakpoints and watchpoints available and what else should i know about breakpoints?.
Halting the Target Manually
When debugging, you may resume application and enter code waiting for some event or staying in infinite loop without any break points defined. In such case, to go back to debugging mode, you can break program execution manually by pressing “Continue/Pause” button. To check it, delete all breakpoints and click “Continue”. Then click “Pause”. Application will be halted at some random point and LED will stop blinking.
It is also possible to step through the code using “Step Into (F11)” and “Step Over (F10)” commands. The difference is that “Step Into (F11)” is entering inside subroutines calls, while “Step Over (F10)” steps over the call, treating it as a single source line.
Before being able to demonstrate this functionality, using information discussed in previous paragraph, make sure that you have only one breakpoint defined at line 57 of blink.c.
Resume program by entering pressing F5 and let it halt. Now press “Step Over (F10)”, one by one couple of times, to see how debugger is stepping one program line at a time.
Stepping Through the Code
If you press “Step Into (F11)” instead, then debugger will step inside subroutine call.
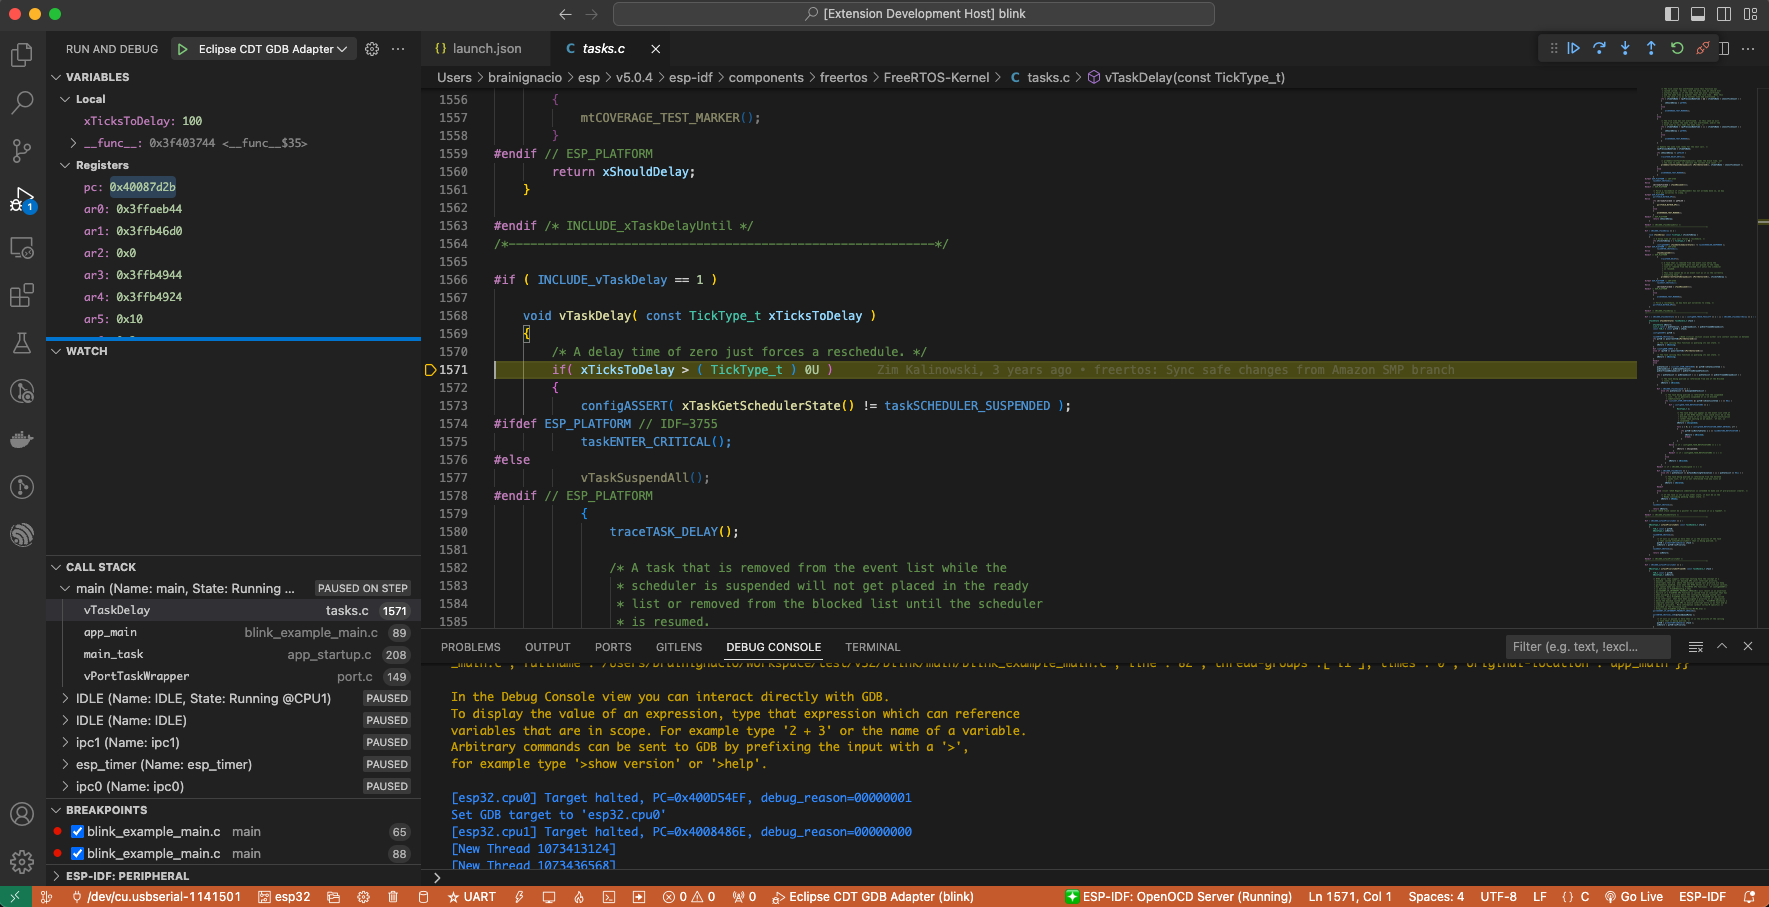
In this particular case debugger stepped inside vTaskDelay(CONFIG_BLINK_PERIOD / portTICK_PERIOD_MS) and effectively moved to tasks.c code.
Note
See Why stepping with “next” does not bypass subroutine calls? for potential limitations using the
nextcommand.
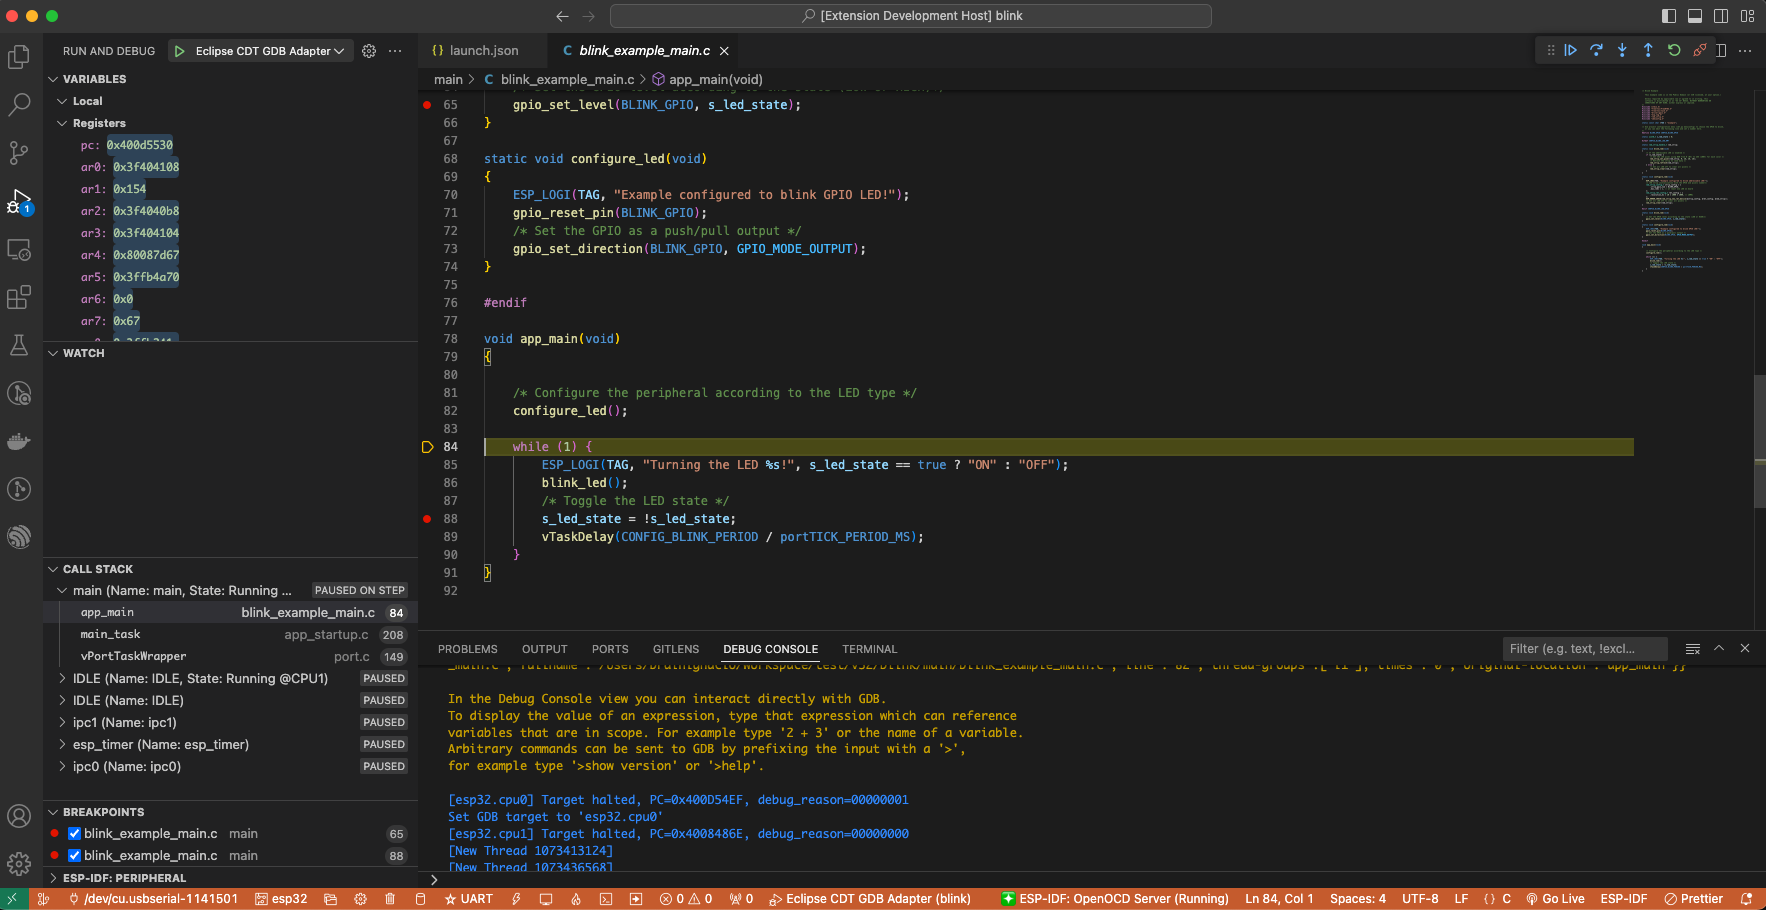
If you press “Step Out (Shift + F11)” instead, then debugger will step outside the subroutine call.
Watching and Setting Program Variables
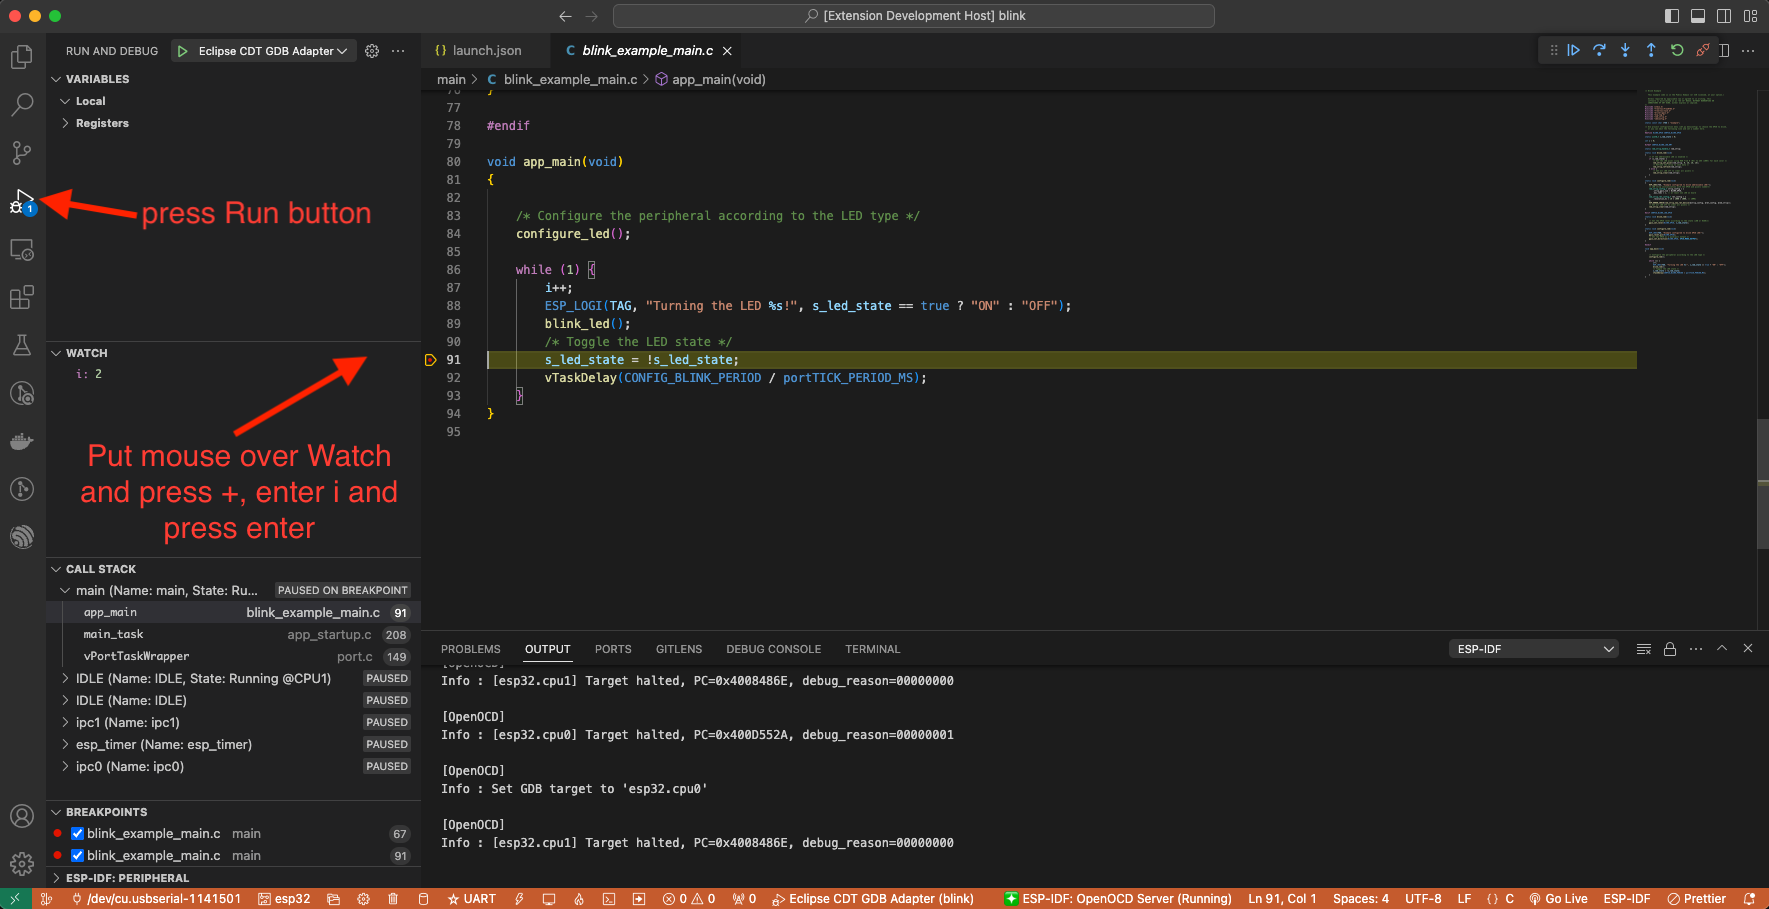
A common debugging tasks is checking the value of a program variable as the program runs. To be able to demonstrate this functionality, update file blink.c by adding a declaration of a global variable int i above definition of function blink_task. Then add i++ inside while(1) of this function to get i incremented on each blink.
Stop debugging by pressing “Stop (Shift + F5)”. Build and flash the code to the ESP and restart the debugger by pressing F5. Once the application is halted, set a breakpoint in the line where i++ is.
Next in the Watch sub-window on the Run icon in the Activity Bar on the side of Visual Studio Code, click the + and enter i to start watching its value.
Continue the program execution by pressing F5. Each time the program is halted, you will see i being incremented.
Setting Conditional Breakpoint
You can also set a breakpoint to halt the program execution if a certain condition is satisfied. See Visual Studio Code conditional breakpoints.
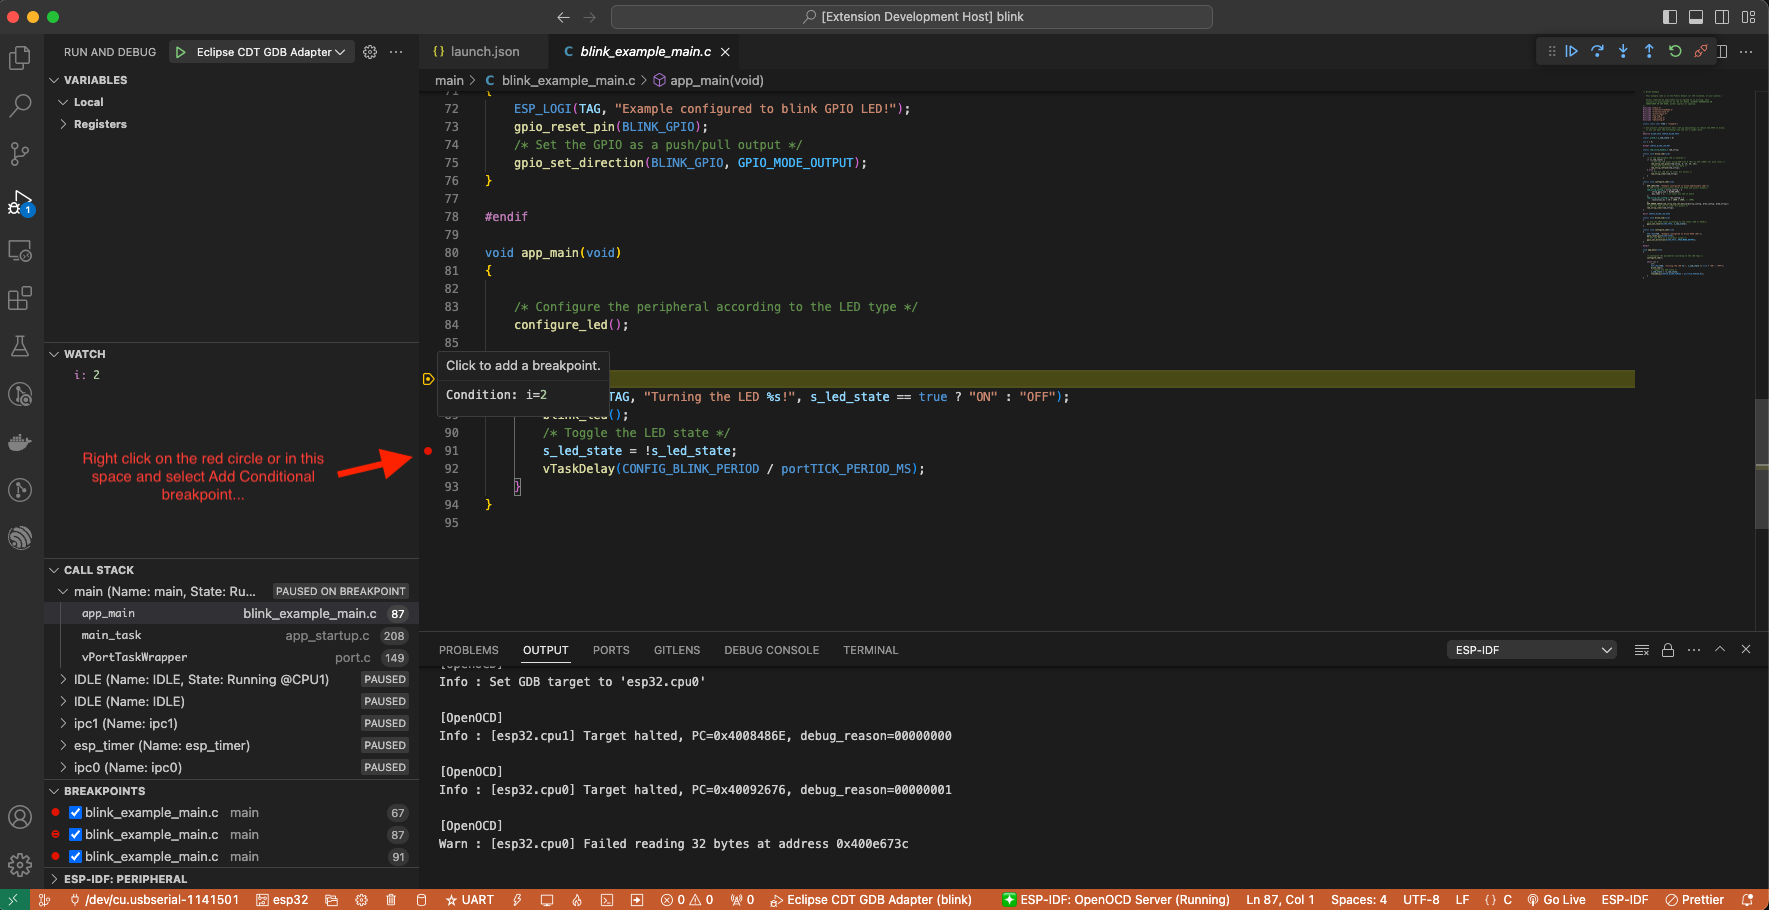
To set a new conditional breakpoint, go to the desired line and right click on the circle shown next to the line number (editor margin) and select Add Conditional Breakpoint action. You can also modify a breakpoint to add a condition in the list of breakpoints in the Breakpoints sub-window on the Run icon in the Activity Bar on the side of Visual Studio Code. Click the pencil icon on the breakpoint and set the breakpoint condition.
For this example, go to line 79 and right click on the circle shown next to the line number (editor margin) and select Add Conditional Breakpoint action and set i=2. When you start the debug, it will stop on line 79 when i has value of 2.
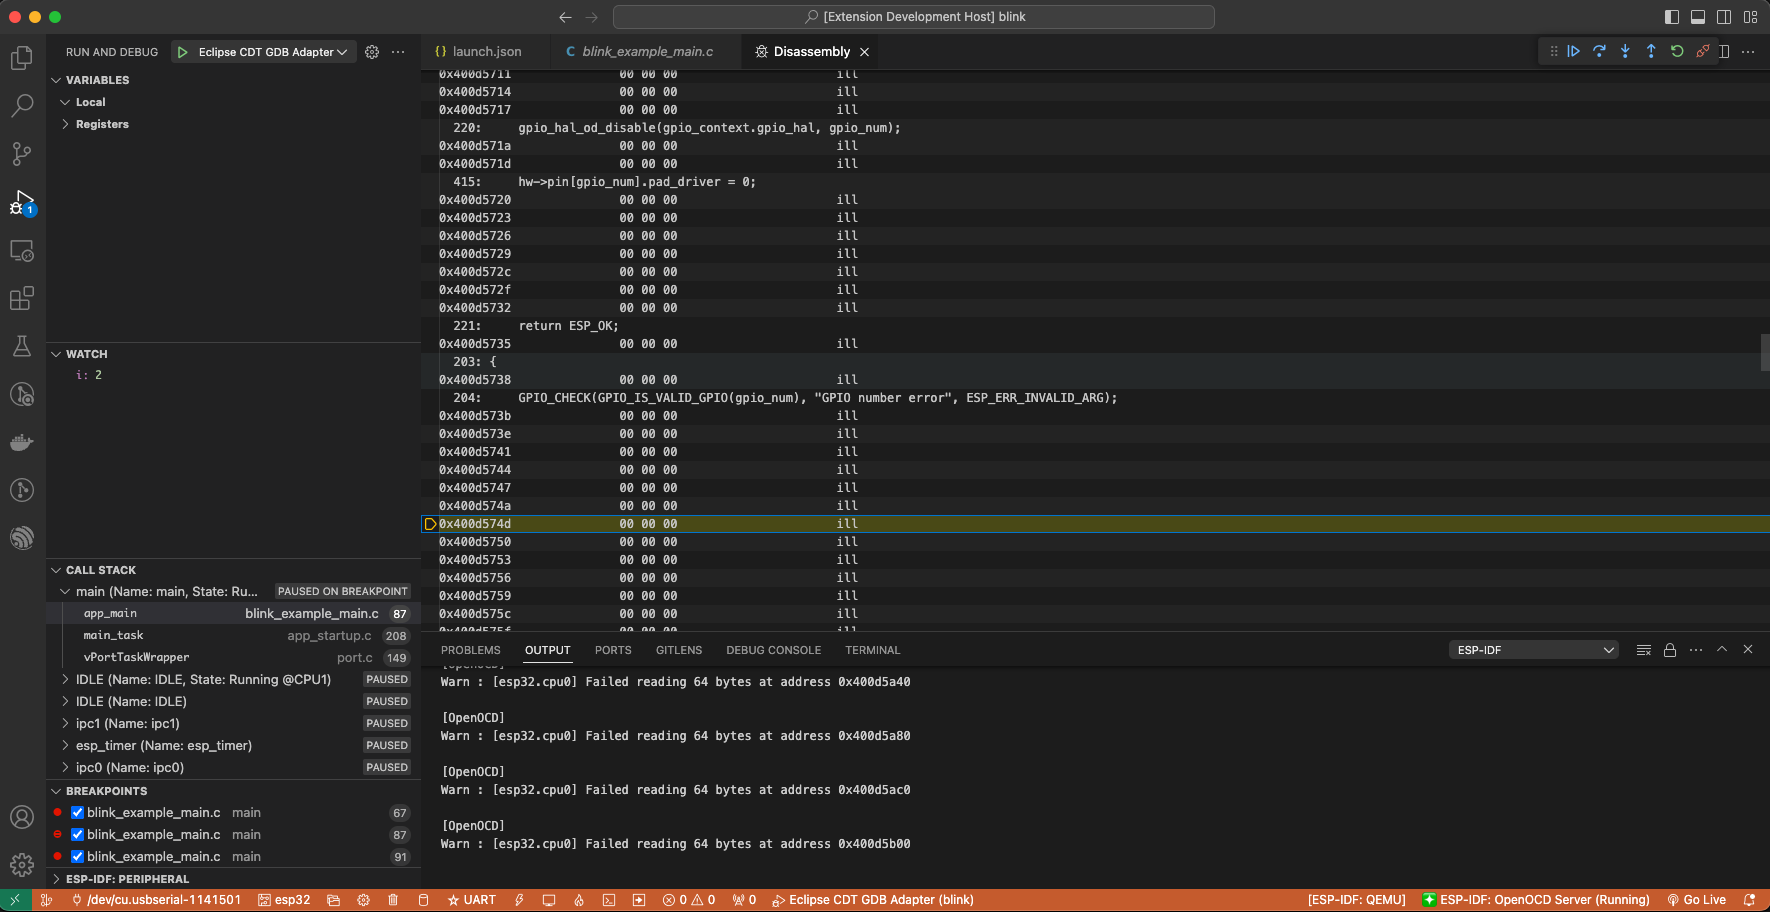
Disassembly view
You can check the assembly code from the debugging session by doing a right click in any line in of source code file and pressing Open Disassembly View. This will open the Disassemble View showing the assembly code with C code where you can set breakpoints too.
Watchpoints (Data Breakpoints)
See ESP-IDF breakpoints and watchpoints available for more information.
Send commands to GDB
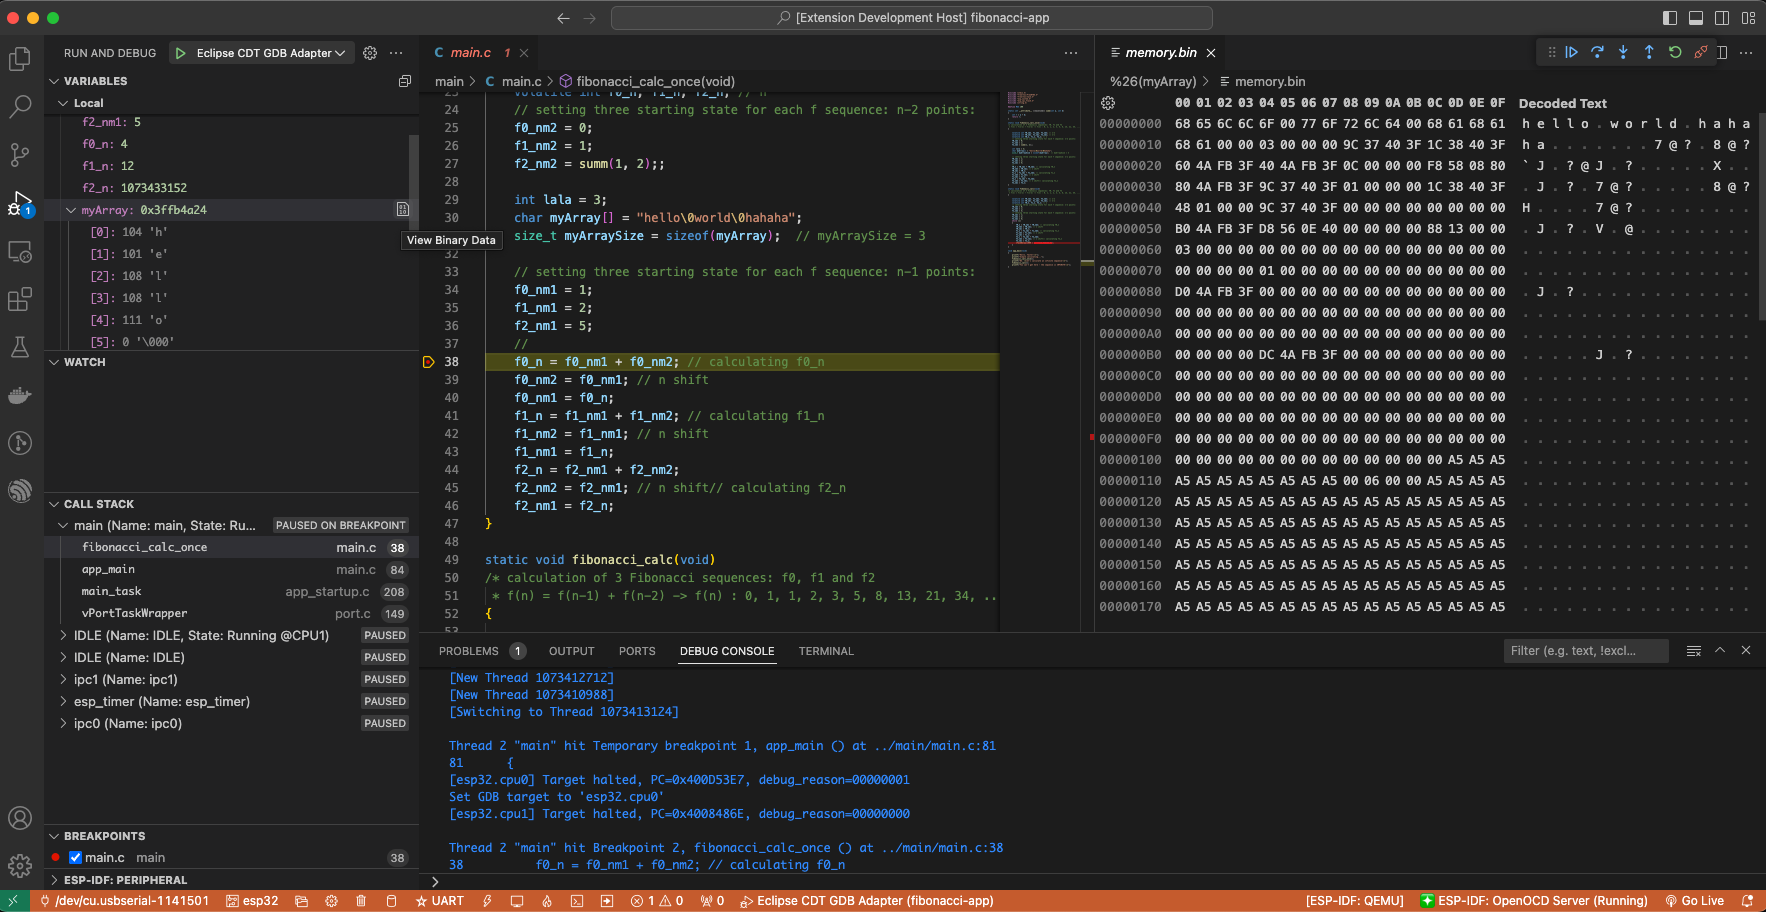
You can send any GDB commands in the Debug console with > COMMAND. For example > i threads.
You can also see binary data variables content clicking View Binary Data next to variable name.
More about Command Line Debugging.
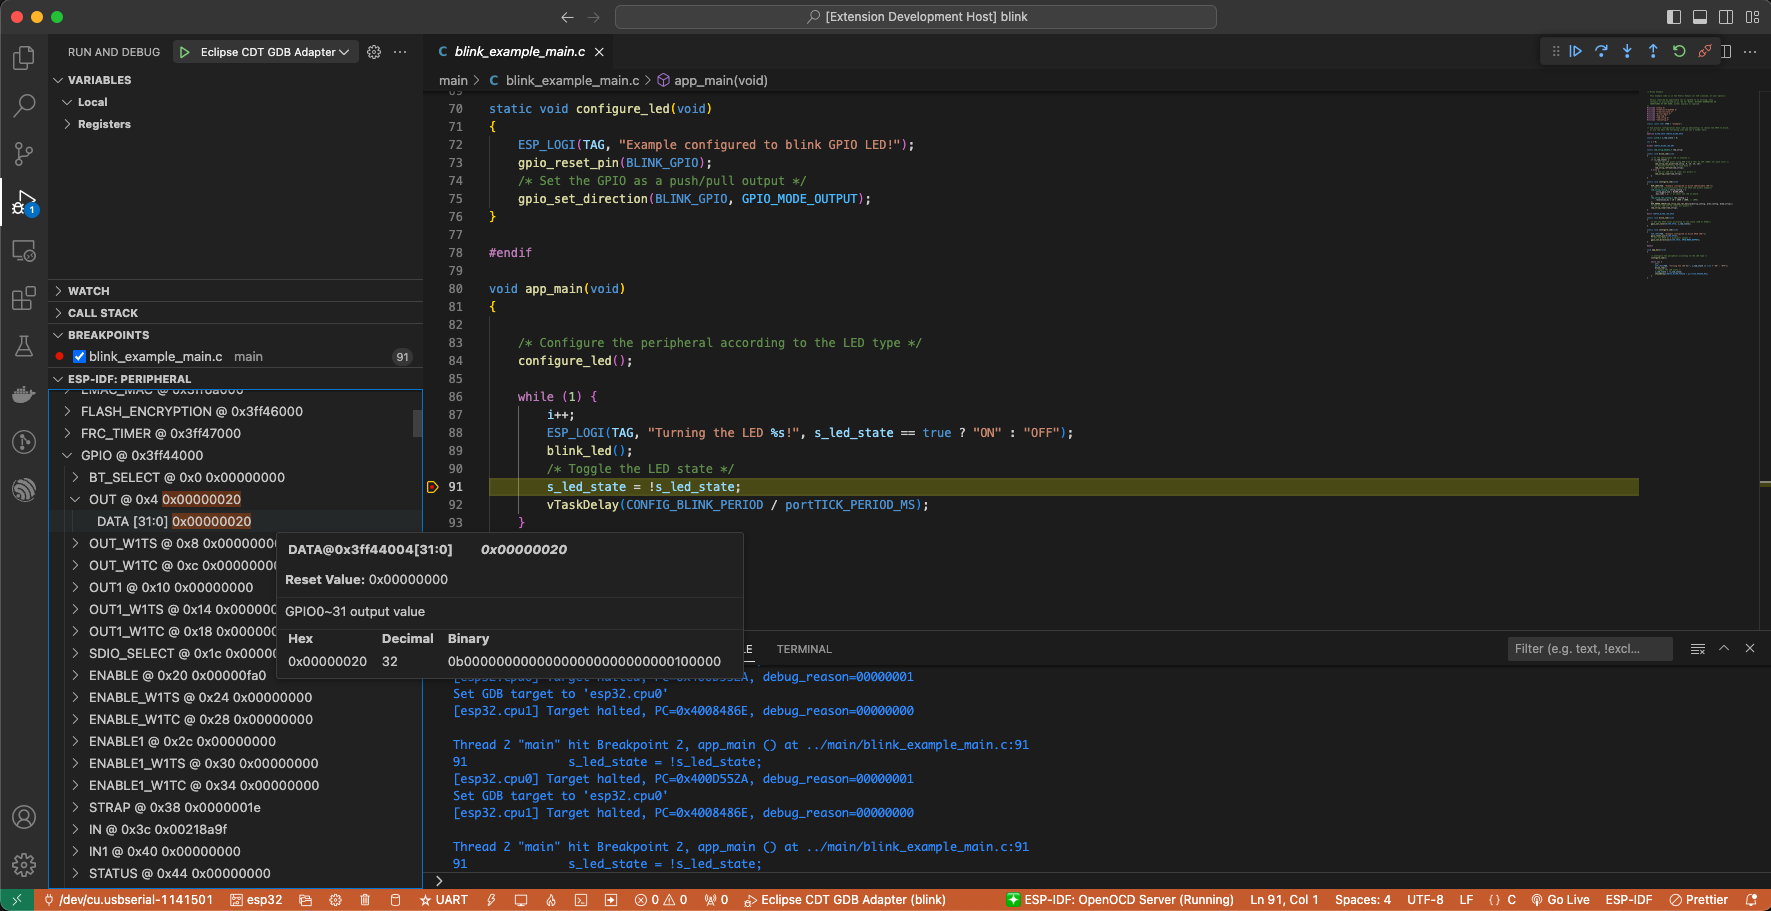
ESP-IDF: Peripheral View
Our extension implements a ESP-IDF: Peripheral View tree view in the Run and Debug view which will use the SVD file defined in the IDF Svd File Path (idf.svdFilePath) configuration setting to populate a set of peripherals registers values for the active debug session target. You could download Espressif SVD files from Espressif SVD repository.
Post-mortem debug use cases
You can start a monitor session that can capture fatal error events with ESP-IDF: Launch IDF Monitor for CoreDump / GDB-Stub Mode command and, if configured in your project’s sdkconfig, trigger the start of a debug session for GDB remote protocol server (GDBStub) or ESP-IDF Core Dump when an error is found. Read more in the panic handler documentation.
Core Dump is configured when Core Dump’s Data Destination is set to either
UARTorFLASHusing the ESP-IDF: SDK Configuration Editor extension command oridf.py menuconfigin a terminal.GDB Stub is configured when Panic Handler Behaviour is set to
Invoke GDBStubusing the ESP-IDF: SDK Configuration Editor extension command oridf.py menuconfigin a terminal.