ESP-IDF Coverage
Source code coverage is data indicating the count and frequency of every program execution path that has been taken within a program runtime. GCOV is a GCC tool that, when used in concert with the compiler, can generate log files indicating the execution count of each line of a source code.
Your ESP-IDF project should be configured to generate gcda/gcno coverage files using gcov. Please read GCOV Code Coverage to learn more about code coverage with GCOV in ESP-IDF projects.
You can use the ESP-IDF: Configure Project SDKConfig for Coverage to set required configuration in the SDK Configuration Editor.
Code coverage example
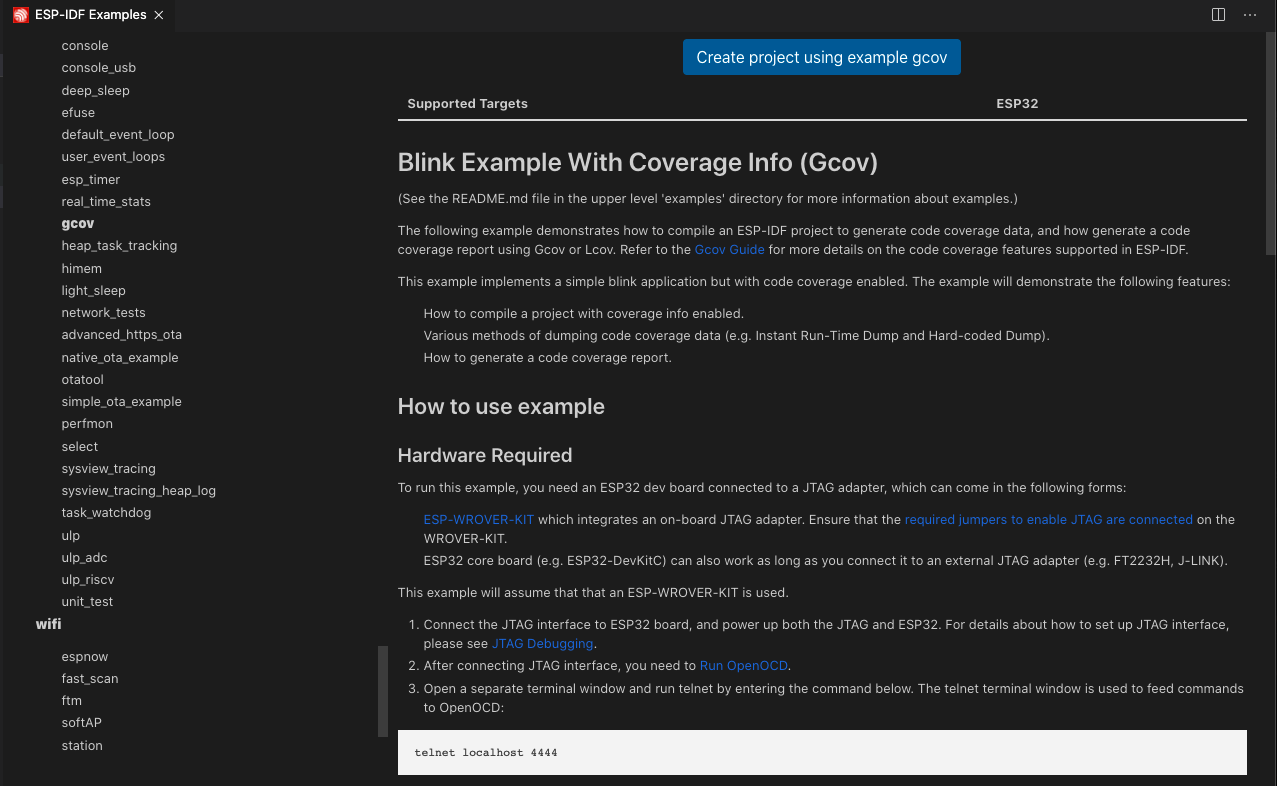
Let’s use the ESP-IDF GCOV Example for this tutorial.
Navigate to View > Command Palette.
Type ESP-IDF: Show Examples Projects and choose
Use Current ESP-IDF (/path/to/esp-idf).
If you don’t see the option, please review the current ESP-IDF setup in Installation.
A window will be open with a list a projects, go the system section and choose the
gcov. You will see a Create Project Using Example gcov button in the top and a description of the project below. Click Create Project Using Example GCOV button.
Now select a container directory where to copy the example project. For example, if you choose
/Users/myUser/someFolderthe resulting folder will be/Users/myUser/someFolder/gcov. This new project directory will be created and opened in Visual Studio Code.First you should select an Espressif target (esp32, esp32s2, etc.) with:
Navigate to View > Command Palette.
Type ESP-IDF: Set Espressif Device Target command. Default is
esp32and the one used in this tutorial.
Next configure your sdkconfig project with the ESP-IDF: Configure Project SDKConfig for Coverage command or by yourself using the ESP-IDF: SDK Configuration Editor command where you can modify the ESP-IDF project settings. After all changes are made, click save and close this window.
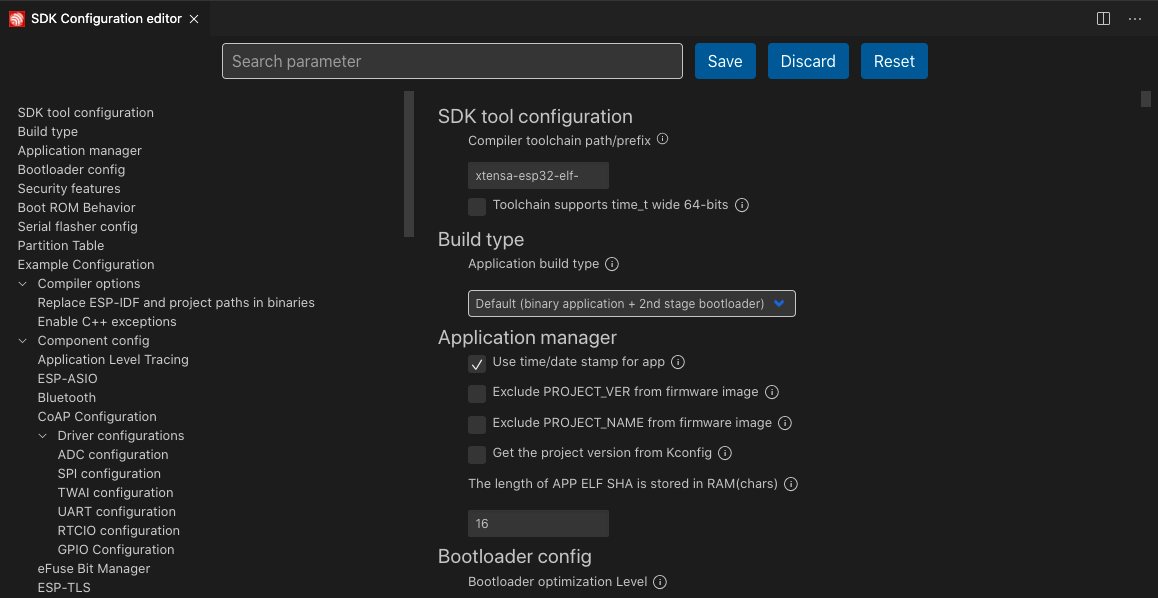
The example will enable the following options by default:
Enable the Application Tracing Module under
Component Config>Application Level Tracing>Data Destinationby choosingTrace Memory.Enable GCOV to host interface under
Component Config>Application Level Tracing>GCOV to Host Enable.Enable OpenOCD Debug Stubs under
Component Config>ESP32-specific>OpenOCD Debug Stubs.
Now build the project, flash your device and start the ESP-IDF Monitor you can use the ESP-IDF: Build your Project, ESP-IDF: Flash your Project and ESP-IDF: Monitor Device commands.
Note
There is also a ESP-IDF: Build, Flash and Start a Monitor on your Device command which does all three former commands in one.
Next step is to launch OpenOCD and send some commands. To start openOCD from the extension, execute the ESP-IDF: OpenOCD Manager command or from the
OpenOCD Server (Running | Stopped)button in the Visual Studio Code status bar. OpenOCD server output is shown in menu View > Output > ESP-IDF.Launch a new terminal with menu Terminal > New Terminal and execute
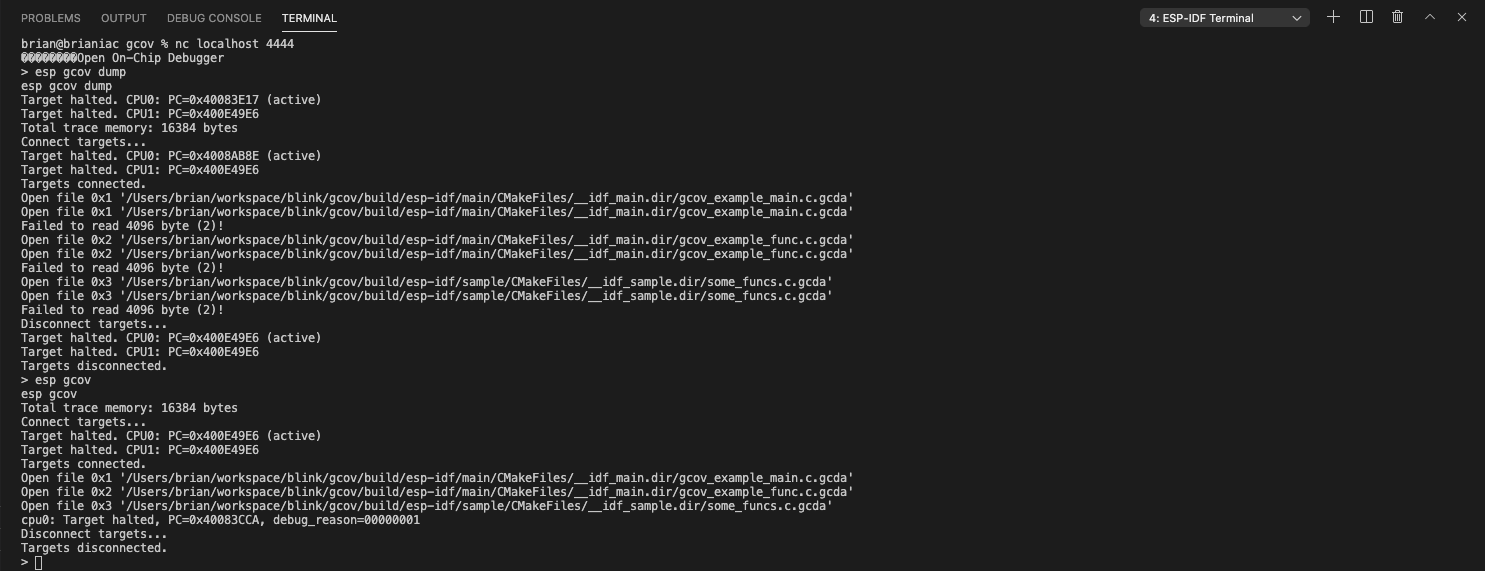
telnet <oocd_host> <oocd_port>which by default istelnet localhost 4444. Latest MacOS users can usenc <oocd_host> <oocd_port>iftelnetis not in the system.
Note
you can modify openocd.tcl.host and openocd.tcl.port configuration settings to modify these values.
Send the OpenOCD command
esp gcov dumpfor hard-coded dump which will dump two hard-coded dumps based on this example. After that send theesp gcovcommand for instant run-time dump.
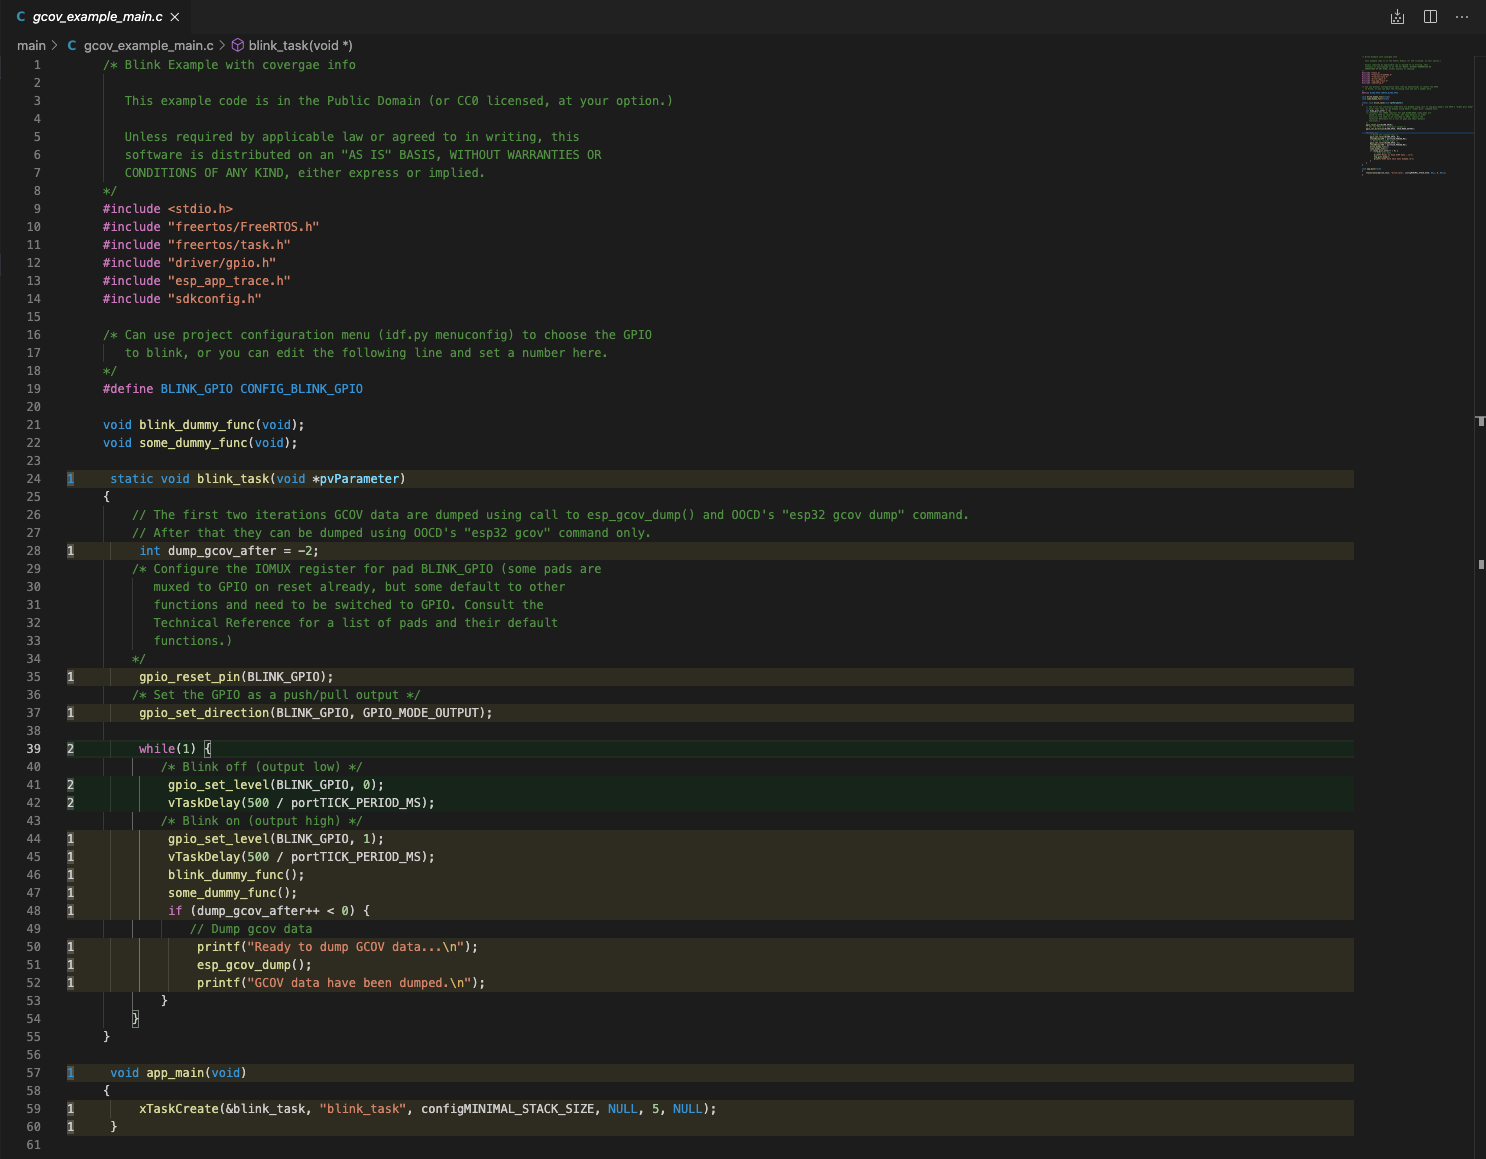
After dumping data one or more times, open the desired file in your editor and execute the ESP-IDF: Add Editor Coverage command to highlight the editor with code coverage.
You can customize highlight color using these extension settings.json configuration settings:
Covered lines use idf.coveredLightTheme for light themes and idf.coveredDarkTheme for dark themes.
Partially covered lines use idf.partialLightTheme for light themes and idf.partialDarkTheme for dark themes.
Non-covered lines use idf.uncoveredLightTheme for light themes and idf.uncoveredDarkTheme for dark themes.
Visual Studio code support "red", rgb(255,0,120) or rgba(120,0,0,0.1).
When finished, use the ESP-IDF: Remove Editor Coverage command to remove the code coverage.
Navigate to View > Command Palette.
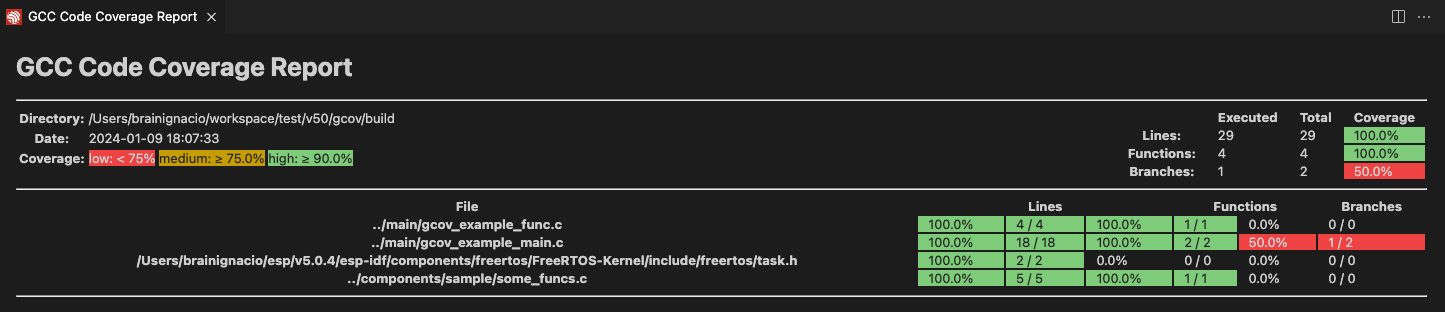
Type ESP-IDF: Get HTML Coverage Report for Project select the command to generate a HTML report for code coverage.
Note
Check the Troubleshooting section if you have any issues.